
Now that we more than half way through the year, we thought it would be interesting to look into the rearview mirror to see how this year has gone, what we got right and what we got wrong, and finally to look at our portfolio today to provide some insight as to how we see the future.
This note will look at three of our main bundles:
- Enhanced Equity (available on your ZAR account)
- Enhanced Balanced (available in the ZAR and RA account)
- Enhanced International Equity (available on the USD account)
Year to date (at the time of writing) this portfolio has returned 14.50% compared to the Top 40 total return (assuming reinvestment of dividends) of 3.24%.
However, this year has really been a tale of two halves. During the first quarter of the year (January to end of March) the Top 40 had a total return of -18.38% while this portfolio was down -9.57%. We were protected in this downturn due to our higher weighting in materials and technology while we were also underweight financials and consumer discretionary stocks.
The portfolio slightly underperformed the Top 40 total return in the second quarter – the index up was 23.41% while we were up 21.79%. However, since we protected the portfolio on the downside, the portfolio is still ahead of its benchmark by 11.26% for the year. The reason for the underperformance was for the same reason we outperformed before, i.e. we had less exposure to consumer discretionary and financial stocks which rallied during that time. However, despite being underweight in certain sectors, our specific stock picks outperformed. For example we had about 5.09% exposure to financials VS 14.10% exposure for the Top 40, however our financial stock picks returned 24.75% during this time compared to the 9.76% return of financial stocks in the index thus although we were less exposed to those sectors that rallied the most we still participated due to our specific stock factors. In material, we were overweight gold miners instead of platinum miners and this was also a drain.
The below graph shows the sector breakdown of our stocks excluding ETFs.
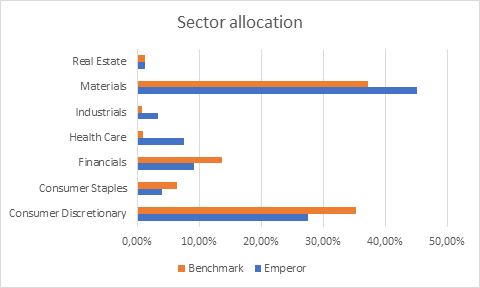
Going forward we continue to be overweight materials and healthcare. In the materials sector we have more gold than platinum and other resources, and this has started to enhance the portfolio once again (month to date our material stocks have returned 11.25% compared to the 5.49% return of this sector in the Top 40 index, note this is within sector, you still need to multiply this return by the allocation to the materials sector to calculate the contribution of the sector to the total return of the portfolio). Gold and other precious metals can be counted on as a store of value in times when markets are in distress and money is being printed. We also continue with our exposure to technology which we expect to continue to outperform in the future.
The balanced portfolio is a blend of the Enhanced Equity Bundle together with fixed income exposure that we gain via ETFs. This portfolio is Reg 28 complaint so that it is offered as both part of the ZAR account and the Retirement Annuity account.
During the first quarter of the year SA bonds were down -6.98% compared to the Top 40 -18.38% and the ASISA high equity average of -14.06% (the ASISA high equity average return is the weighted average return of all balanced unit trusts in South Africa in the high equity category) ; i.e. these bonds provided some protection during this time. Our stocks, as we discussed in the Enhanced Equity section above) were down -9.57% during this time. Thus, bonds didn’t provide too much protection overall due to our superior stock selection. This portfolio was down 9.14% in the first quarter.
Year to date (at the time of writing) this portfolio is up 7.70 % VS -2.58% for ASISA high equity average. You can compare this to other balanced bundles on the platform here . The stocks and sectors that contributed the most to our returns were the same as the Enhanced Equity bundle as SA bonds have returned just 0.19% this year.
Note, we also have Enhanced Moderate and Conservative bundles. These bundles are similar to the Enhanced Balanced bundle in that they are a mixture of SA government bonds and equities, however as we go down the risk spectrum we allocate more to bonds and less into equities.
Enhanced USD Bundle (Log into your EasyEquties account to view)
Emperor recently launched the Enhanced USD bundle. This portfolio consists of similar stocks with the same strategy as our global unit trust which is the best performing unit trust both this year and over the last three years according to ASISA data. Check out the Unit Trust factsheet here. (Prior to the launch of the Enhanced USD bundle we only had the Emperor’s Core International Equity bundle, this bundle ended the first 6 months with a positive 13.3% return, while the benchmark MSCI World index was down 6.61%).
As at the time of writing, this portfolio (the unit trust) is up 54.43% in USD compared to 0.04% for the MSCI World total return index. We are using the unit trust to compare performance as the Enhanced USD International bundle was not started at the time and this bundle is invested in a similar way to the unit trust. (This portfolio was down -7.52% in USD at the end of the first quarter compared to a -20.89% USD return for the MSCI World total return index).
The portfolio invests in companies using the Emperor algorithmic model
- Our model right now is predisposed to momentum companies – those with growing revenue and price appreciation. This results in a thematic portfolio with a technology blend – e-commerce, internet streaming services, gaming/home entertainment, cloud services with some healthcare and consumer staples.
We believe the portfolio is positioned to outperform during these volatile market conditions. Most of the companies we invest in have shown improved conditions as lockdown and social distancing measures push people to find alternative ways to stay connected and entertained.
All Performance data sourced from Bloomberg on July 2020.
Disclaimer:
Terms and conditions apply. Emperor Asset Management (Pty) Ltd is an authorised financial services provider (FSP no. 44978). The value of a financial product can go down, as well as up, due to changes in the value of the underlying investments. An investor may not recoup the full amount invested. Past performance is not necessarily an indication of future performance. These products are not guaranteed. This document is for information purposes only and does not constitute or form part of any offer to issue or sell, or any solicitation of any offer to subscribe for or purchase any particular investment. Opinions expressed in this document may be changed without notice any time after publication. We therefore disclaim any liability for loss, liability, damage (whether direct or consequential) or expense of any nature whatsoever which may be suffered as a result for which may attributable directly or indirectly, to the use of or reliance upon the information.